In today's data-driven world, the ability to analyze and present data effectively is a crucial skill. Whether you're a business analyst, financial expert, or data enthusiast, mastering Microsoft Excel for advanced data analysis and dashboard reporting can significantly enhance your decision-making capabilities.
Our Advanced Data Analysis and Dashboard Reporting with Microsoft Excel Training Course is designed to take your Excel skills to the next level. Over 10 days, you’ll learn how to transform raw data into powerful insights using advanced Excel functions, PivotTables, Power Query, and interactive dashboards.
Why Attend This Course?
Here's what makes this training program stand out:
? Hands-on, practical approach - Learn by working with real-world datasets
? Expert instructors - Get trained by certified Excel professionals
? Comprehensive curriculum - Covers everything from fundamentals to advanced techniques
? Career advancement - Add valuable skills to your professional toolkit
? Networking opportunities - Connect with like-minded professionals
? Immediate application - Use your new skills at work right away
Excel is more than just spreadsheets—it’s a powerful tool for data manipulation, visualization, and reporting. This course will help you:
· Analyze large datasets efficiently with advanced Excel functions.
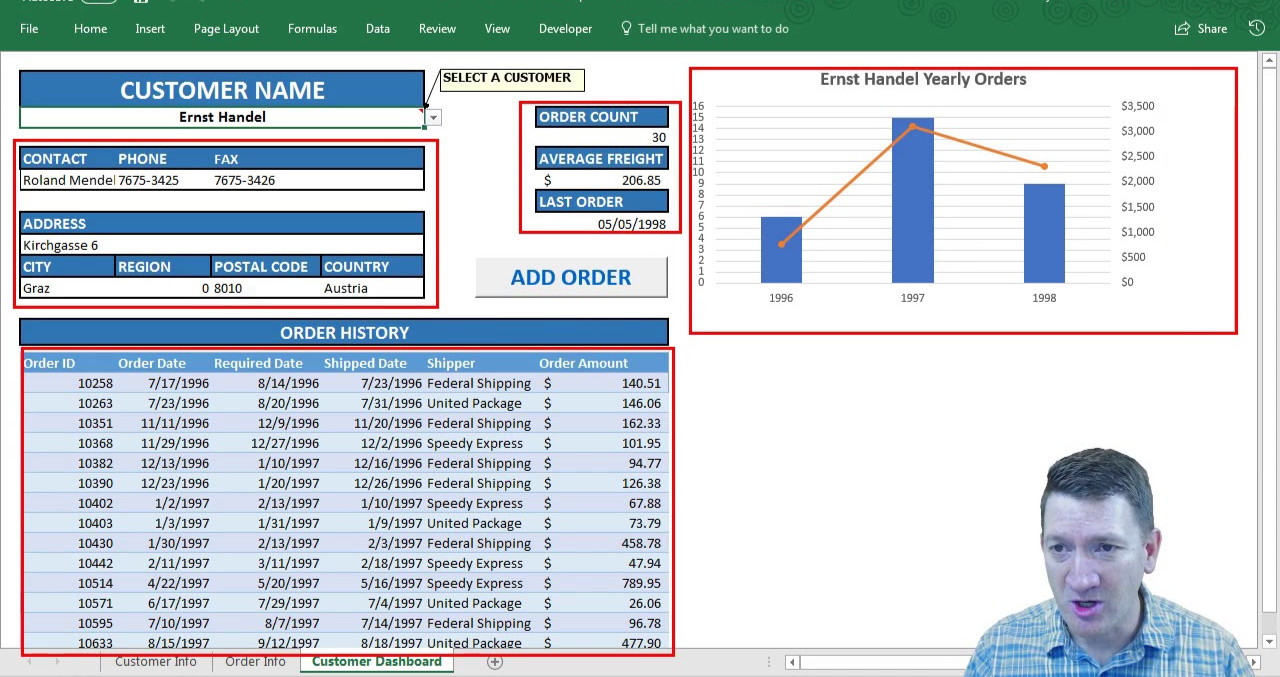
· Create dynamic dashboards that provide real-time business insights.
· Automate data cleaning and transformation using Power Query.
· Use PivotTables and PivotCharts for in-depth data exploration.
· Apply advanced formulas (XLOOKUP, INDEX-MATCH, array formulas) for complex calculations.
· Build interactive reports with slicers, timelines, and conditional formatting.
? Duration: 10 Days (Intensive Hands-on Training)
? Skill Level: Intermediate to Advanced Excel Users
? Format: Instructor-led (Virtual or In-Person)
? Certification: Receive a certificate upon completion
1. Advanced Data Analysis Techniques
o Statistical and What-If Analysis
o Data validation and error handling
o Solver and Scenario Manager
2. Power Query & Power Pivot
o Importing and transforming data from multiple sources
o Creating data models for advanced reporting
3. Dashboard Creation & Visualization
o Designing interactive dashboards
o Using charts, sparklines, and conditional formatting
o Incorporating slicers and timelines for user-friendly reports
4. Automation with Macros & VBA Basics
o Recording and running macros
o Introduction to VBA for custom automation
This course is ideal for:
· Business Analysts
· Financial Professionals
· Data Analysts & Reporting Specialists
· Managers & Team Leaders
· Anyone looking to enhance their Excel skills for better data-driven decisions
Unlock the full potential of Excel and become a data analysis expert with our 10-day intensive training. Whether you're preparing reports for stakeholders or analyzing business performance, this course will equip you with the skills to work smarter, not harder.
? Limited seats available! Register now to secure your spot.
#ExcelTraining #DataAnalysis #DashboardReporting #MicrosoftExcel #BusinessIntelligence #DataVisualization
Phoenix Training Center
Typically replies in minutes


